


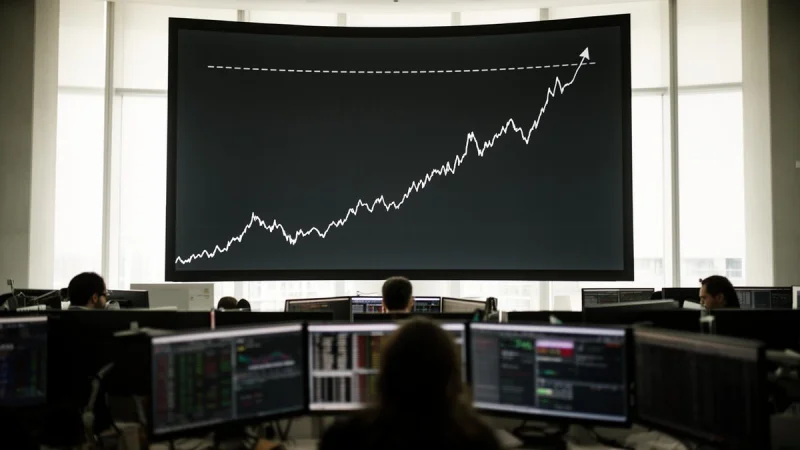
The S&P 500’s Shiller P/E Ratio closed at 42.04 on Aug. 31, a level that leaves U.S. stocks trading near a bull market high even after another run of record closes. The measure, also called the CAPE Ratio, is based on average inflation-adjusted EPS over the trailing decade.
That matters now because the Dow Jones Industrial Average, the S&P 500 and the Nasdaq Composite have all posted several record highs this year, even as the market has had to absorb above-average inflation, the Iran war, President Donald Trump’s tariffs and long-duration Treasury bond yields at their highest level since the financial crisis. Investors searching for a Federal Reserve equity risk premium warning are really looking at a market that has kept climbing while the valuation math has moved in the opposite direction.

The CAPE Ratio has been backtested to January 1871, and its long-run average is 17.4. At 42.04, the reading on Aug. 31 was about 24.6 points above that average, or roughly 2.4 times as high. It was also within 0.80 of the June 1 bull market high of 42.84, a narrow gap that shows how little the valuation picture has changed over the summer.
History says readings above 40 are rare. The S&P 500’s Shiller P/E Ratio has topped that mark on only three occasions, including the present. One of those earlier spells lasted just a couple of trading sessions in the first week of January in 2022. The only higher point in the dataset is 44.19 in December 1999, which still stands as the all-time peak.
That leaves Wall Street with a market that keeps setting price records while its favorite long-term valuation gauge sits in territory seen only a few times in nearly 156 years. The next move in the CAPE Ratio is not the real question; the harder one is how long investors can stay comfortable paying this much for future earnings before the market’s record-setting pace runs into its own valuation ceiling.