
Baseball America has put every team in the 2026 NCAA Tournament field under the same postseason lens, ranking all 64 clubs after the bracket was set and judging them more on what they can do now than what they already did. The result is a full-field snapshot built around offense, pitching, defense, run differential per game and average fastball velocity, with each category graded on a 20-to-80 scale.
For readers searching the ncaa super regional schedule, that matters because the bracket is no longer just a map of who plays whom. It is now a checklist of which teams look built for the next round, and which ones may have already peaked. Baseball America’s approach centers on postseason fit, not regular-season résumé, which is why the rankings read less like a standings table and more like a forecast for who can survive regional and super regional play.
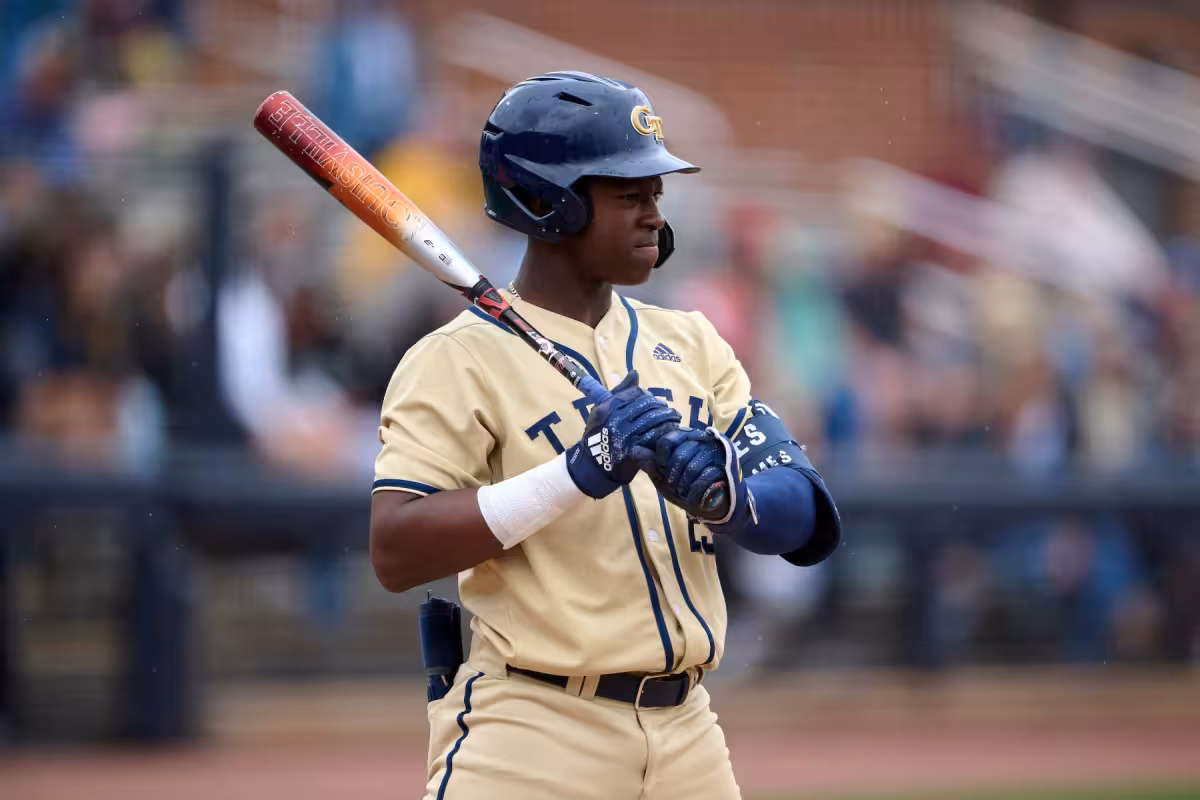
Georgia Tech came out looking like one of the tournament’s most dangerous lineups. The Yellow Jackets were given an 80 for run production and a 60 for run prevention, and their batting order was described as the best in the field. C Vahn Lackey, Drew Burress and Jarren Advincula gave them the star power, while multiple position players were projected as first-round picks. Tate McKee was cast as a solid ace, but the same evaluation warned that Tech could still be overpowered on a given day by a deeper pitching staff.
Georgia drew a similar offensive grade, with an 80 for run production, and its case rested on a power surge that had nothing subtle about it. The Bulldogs hit the most home runs in Division I, rarely struck out and drew an absurd number of walks, including an 11.6% walk rate that kept innings alive and pressure constant. Daniel Jackson, Joey Volchko and Tre’ Phelps supplied the star power, but Georgia’s 55 grade for run prevention left more room for concern than its bat-heavy profile suggested.
UCLA and North Carolina sat on the other side of the equation, teams built to win with balance rather than just blast. UCLA’s star group of Roch Cholowsky, Will Gasparino and Mulivai Levu helped it earn a 60 for run production and a 70 for run prevention, with the Bruins averaging 8.2 runs per game. Their pitching and defense were both rated highly, but Logan Reddemann’s absence since mid-April was the detail that kept the staff from looking like a truly elite, 80-grade unit.
North Carolina also arrived with a strong two-way profile. The Tar Heels were given a 60 for run production and a 70 for run prevention, with Owen Hull, Ryan Lynch, Jason DeCaro and Jake Schaffner leading the star-power assessment. Schaffner, Hull, Cooper Nicholson, Colin Jayek and Gavin Gallaher drove the offense, while the staff’s numbers stood out nationally: eighth in ERA, 32nd in FIP and 37th in xFIP.
That is the real value of the ranking now. The bracket is set, the comparison has been made, and the question is no longer who got in. It is which of these 64 teams has the profile to keep advancing once the ncaa super super regional schedule tightens and the margins shrink. Georgia’s power game may fit perfectly at Foley Field in the Regionals and Super Regionals, but the rest of the field has already been warned: the path forward will be decided as much by fit as by seeding.